Tutorial: Streamlit Apps with Web APIs
The following is a brief intro tutorial to using Streamlit. In this example I’ll be building an app that demonstrates a potential use case for the EC3 Python Wrapper that I covered in my previous post. While this example will rely on using a python package, the majority of the steps can be applied and adapted to a variety of applications.
(A recorded version of this tutorial is available on the YourDesk University YouTube channel)
In short, Streamlit is an open-source Python framework for building web apps geared towards data science. It’s very easy to get a small web application up and running using just Python. It’s also very well documented, so I will be referring anyone following along to a number of links to their documentation in some of the following steps.
I’ve found Streamlit to be a great tool for creating web applications quickly that can be shared both privately or publicly. Another good use case is prototyping an application that you might later want to later develop in a different platform. That said, Streamlit does have quite a number of limitations that one should be aware of before beginning a project. From a design-perspective you will be very limited to the layouts and styles that are built into Streamlit. Additionally, Streamlit is very inefficient when an application requires lots of user interaction. Each time an action occurs all of the Python code is re-executed. While it does allow you to cache certain values and procedures in the script, it’s still not ideal for an application that would require lots of user interaction.
You can run Streamlit apps locally or you can deploy them publicly (via Streamlit Community Cloud) or privately (via Docker, Kubernetes, or a host of other platforms). This link can point you to instructions for each deployment route. In this tutorial I will be deploying publicly, which will also require that you have git installed, a Github account, and a Streamlit account.
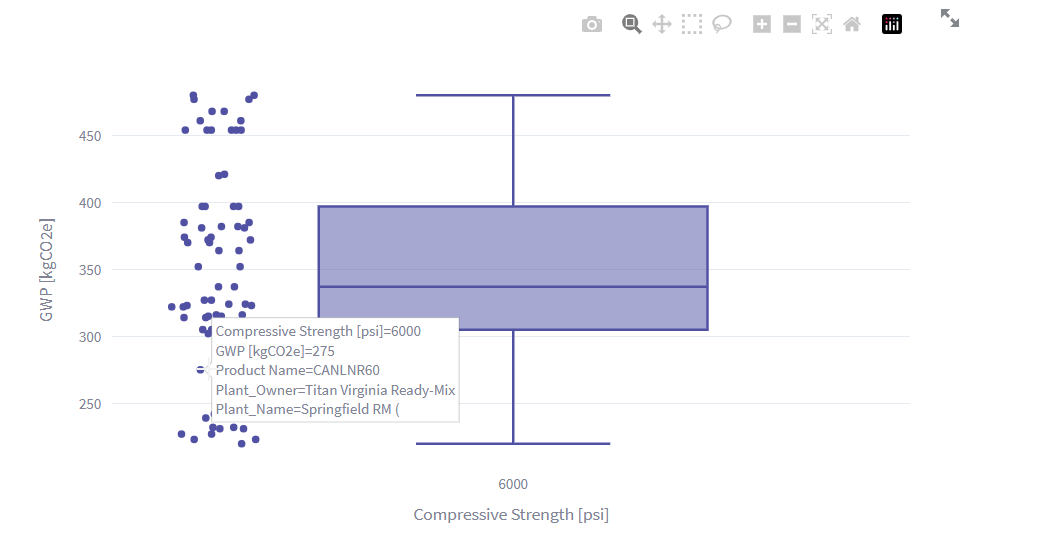
The goal of the demo app that we will build here will be to be able to lookup concrete mixes within a specific region that meet a couple of basic criteria (strength and normal weight vs lightweight). In reality there would be a lot of other criteria that we may want to filter by, but since this tutorial is mainly about learning to use Streamlit with a Web API, we’ll keep things somewhat simple. Ultimately, the app will create two types of visuals: (1) A box plot of the Global Warming Potential (GWP) of the available mixes, and (2) A geographical mapping of the plants that have EPDs for mixes that match our criteria.
Now let’s get to it!
Step 1: Python Packages Setup
Install Streamlit if you don’t yet have it. I recommend installing within a virtual environment and keeping a separate environment for each project – especially if you plan to deploy an app.
Other packages that I will use that can be installed via pip are pandas, plotly, and pydeck.
If you plan to use the EC3 API as I will be doing in the following steps you will also need to install the EC3 Python wrapper and get a bearer token for EC3 (if you don’t plan on using the EC3 API you can feel free to skip this step). To do so, follow the Installation and Authentication steps on the ‘Getting Started’ page of the ec3-python-wrapper readthedocs website.
Step 2: Setting up the Files
Create a folder where all the related files will be kept. If publishing, this will be everything we want to include in the github repo. At a minimum, Streamlit will require us to have a Python file that we will run. Since we’ll be deploying this app, we will also require a few other folders and files. We will have a .streamlit folder where we will store a config.toml file along with our secrets.toml. The config file is optional, but is a nice way to store things like themes (read more about what can be stored in the config here). The secrets file – as you probably guessed – is where we will keep our bearer token for the EC3 API. This is how EC3 will find our token while we test locally. We will add this file to our .gitignore file so that it doesn’t get published, and we will review in a future step how to securely add your secrets to the Streamlit cloud.
Since we’ll be publishing to github, I’ll also be adding a .gitignore file, a README file, a LICENSE file (optional), and a requirements.txt file so that Streamlit and others know what other Python packages are required.
You can feel free to clone the repo here if you want to start with all of the files, and then just create a fresh Python file to follow along. (Note that you will also need to add back the secrets.toml file for testing locally.)
Step 3: Writing and Testing the App Locally
I will just be glossing over the code for the app here since I have broken out the steps into separate Python files in the repo that you can review. We will barely scratch the surface for the various functionality that is built into Streamlit. For a better overview I strongly recommend reading through the official documentation. This tutorial also will not touch upon caching or Session States in Streamlit, which are good functionalities to look into depending on the type of app you are building.
I have broken out the development of the full app into six steps, each of which I have created a file for in the repository. Below is a description of what is covered in each of those files, and each one will build on the previous one. To run the app from the terminal you can write “streamlit run your_python_file.py” to launch your app in an active web browser.
(Tip: While testing your app, if you need to force quit the app, do not try and stop the app by closing the window in the browser. Instead you can ctrl+c in the terminal to terminate the app.)
Here we’ll just create a simple app where we will load an image, and add some text and a button. Notice that we import streamlit as ‘st’. While you can call it anything you like, this is generally how you will see it imported throughout the documentation, so I recommend sticking to it. We’ll make use of some of Streamlit’s builtin functionality such as st.title, st.markdown, and st.button, all of which are fairly self explanatory.

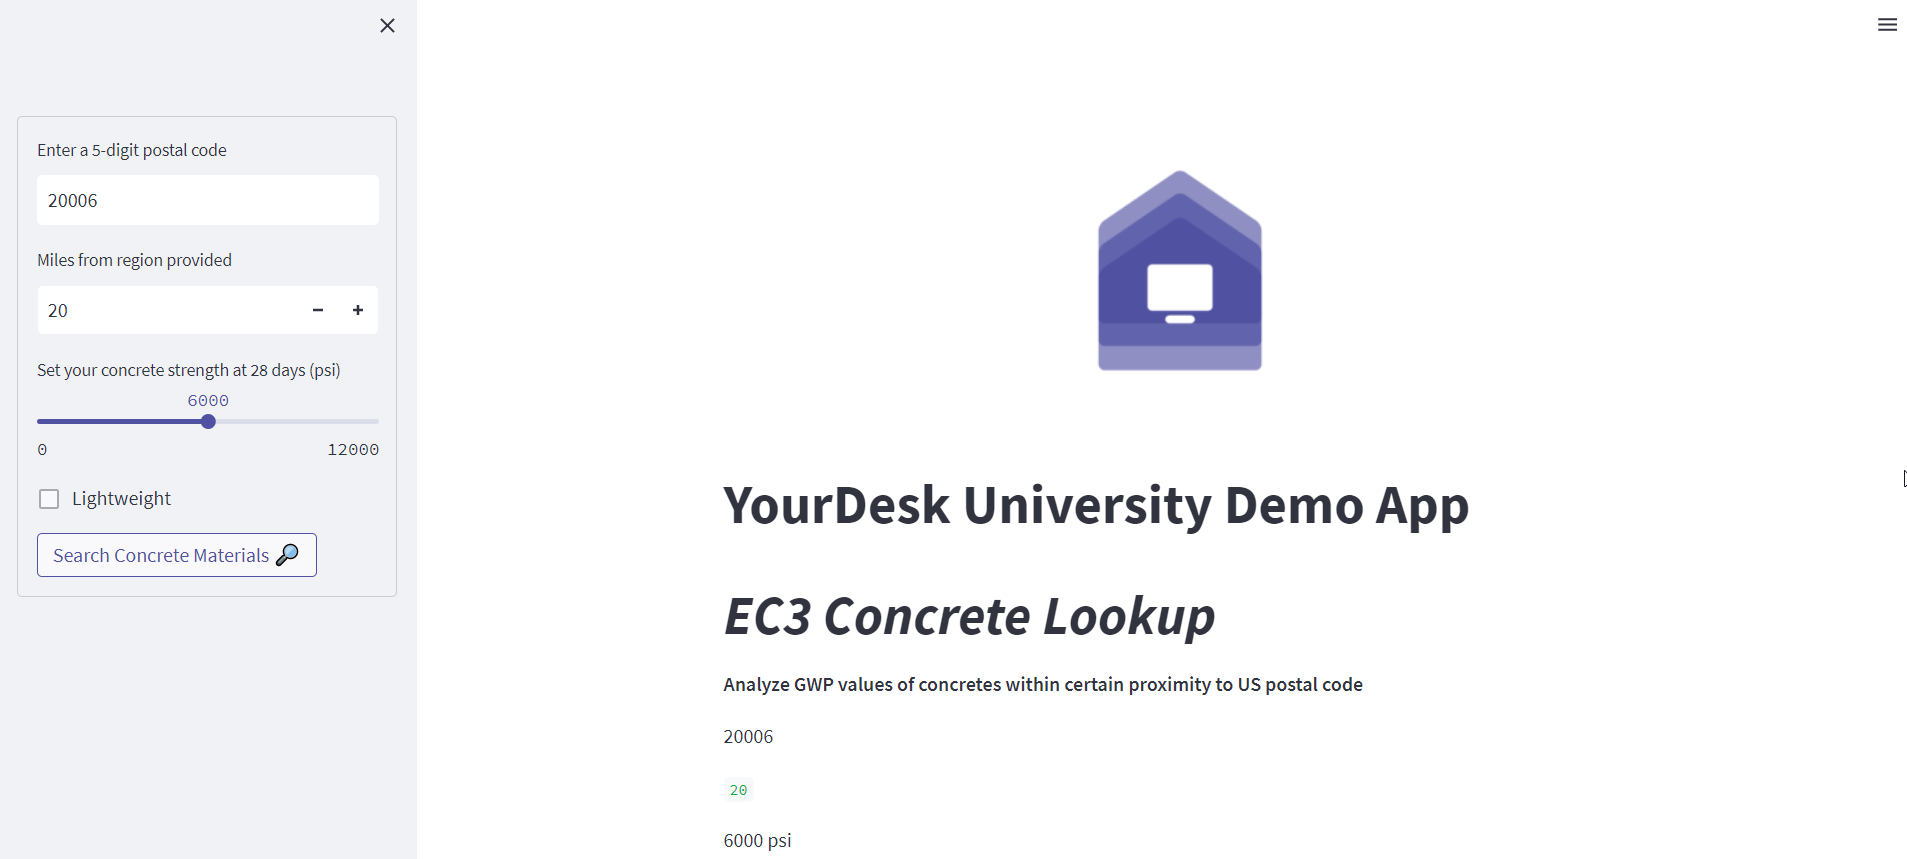
Most Streamlit apps you will see will make use of Streamlit forms. Forms in Streamlit allow you to collect a group of inputs in one click without the entire code rerunning each time one of the inputs is changed. We’ll write out some of the variables collected in the form on the main page just to make sure things are working as expected. We’ll utilize a variety of inputs in the form for purposes of learning some of the common input types available in Streamlit.

In this step we’ll handle the query to the EC3 database based on the inputs from the form. I won’t go into detail here about the query itself, but I recommend learning more at the readthedocs site for the EC3 Python Wrapper for more examples. In this tutorial we’ll use the EC3Materials class in order to use the get_materials_within_region method. Note that we have added a couple of functions inside the Python script. The first function is checking if the user has input a valid postal code into the input by determining if the text can be converted to a five digit integer (a more robust approach might also check if the postal code entered exists geographically, etc.). The second function simply calls the get_materials_within_region function and returns a material record. Again, we’ll make use of Streamlit’s handy st.write method that can print out a Python dictionary that we can inspect. I like to use the st.write method as a gut check while I develop scripts in Streamlit to ensure I’m getting the expected values. Notice that while we only requested to return a specified list of fields for EC3 to return (using the return_fields property), the plant_or_group field is itself a nested dictionary with lots of metadata.
(Note that the number of EPDs returned will vary quite a lot depending on the region and radius of the search. In the example below I’m searching for a normal weight 6000 psi strength mix in a 20 mile radius of the postal code 20006, which is in downtown Washington DC. I know from testing that this will give me a reasonable number of mixes at a scattering of plants, which works well for purposes of the demonstration. Queries returning more than a few hundred materials may take a little while to run. I’ve also capped the max records returned at 2,500 for the sake of keeping the queries within a reasonable limit.)

step4_cleandata.py
The data we get from EC3 is not always going to be very clean. For example, in the case of concrete materials, we’ll find that sometimes the compressive strengths are returned in different units. Also since we plan to plot the plant locations and names, we’ll need to handle any EPDs that might return null values for those (EPDs get entered into EC3 by a wide variety of manufacturers, and so the consistency and quality of the data tends to vary quite a bit). The convert_record function will do these cleaning steps and returns new dictionary with just the data that we’re interested in, that can then be converted into a pandas dataframe. I won’t cover Pandas in this tutorial, but it’s a common package used for working with dataframes, which will also be the expected format in the future visualization steps.
Since our first plot will be of the GWP values, we’ve also added a function here to remove outliers (deemed as values more than 3 standard deviations from the mean in this example). I’ve found that occasionally there will be a GWP value entered into EC3 that is clearly incorrect, and so we’ll want to ignore these. This is done with the remove_outliers function that’s defined in the script. Again, we can leverage the st.write method to view our Pandas dataframe in the browser.

One of the very handy features of Streamlit is that it plays nicely with a handful of the more popular data visualization packages for Python. One of these packages is plotly, which is a library that’s great for making simple and interactive graphs. This is what we will use for the box plot chart. Once the plotly chart object is defined, you can view it in the app using the st.plotly_chart function.

Now we’ll plot the locations of the plants on a map. This is something that I find to be useful that the EC3 website doesn’t currently allow users to do. For this visualization we’ll use the pydeck package, which is a great package for creating both 2D and 3D maps and more. We’ll keep our map simple for this demo, but feel free to experiment on your own. Once the pydeck Deck object is defined we can pass it to st.pydeck_chart to view it in the app.

Step 4: Deploying via Streamlit Community Cloud
While there’s certainly plenty of ways we can continue to improve and expand on this app, we’ll call it good enough for our purposes. Now let’s deploy it!
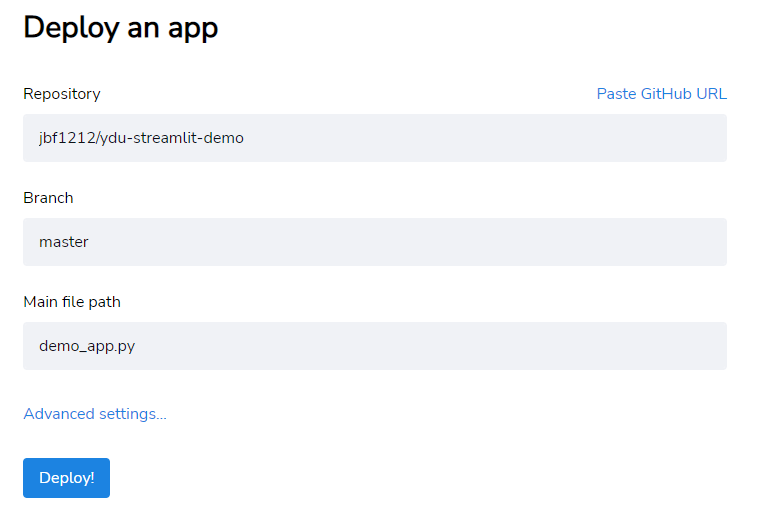
My instructions here will be a paraphrase of what’s on the Streamlit documentation site here. In short, you will start by uploading your files to Github, sign into Streamlit, and follow the prompts to deploy the app. If you’re using the EC3 API, make sure to add your token by clicking the ‘Advanced settings…’ link, and assigning a variable for the token that matches the variable you defined in your secrets.toml file.

You did it! You can now share your app with the world 🙂
