Trends in Energy Heading into 2025
Intro
While the transition into a new year is often a time of hope and excitement, I’d be lying if I said that 2025 feels like it’ll be all rainbows and butterflies. With each passing day it feels like we continue to invent new ways of destroying humanity, electric cars are getting bigger and uglier, and the length of YouTube ads seem to be getting exponentially longer.
At first I thought I’d write a post about some of the positive things I’m seeing around climate change and energy policies as a kind of pick-me up. But we’re already a week into 2025 and the ‘silver-linings’ style articles are starting to feel a bit cliche. Rather than try and cherry-pick just the positive trends I figured I’d just focus on a few things that I’ve been thinking about and discuss the good with the bad.
The following is a very non-comprehensive list of trends in the data – both positive and negative – that I’m looking at heading into the new year.
Global Warming Goals will Not be Met
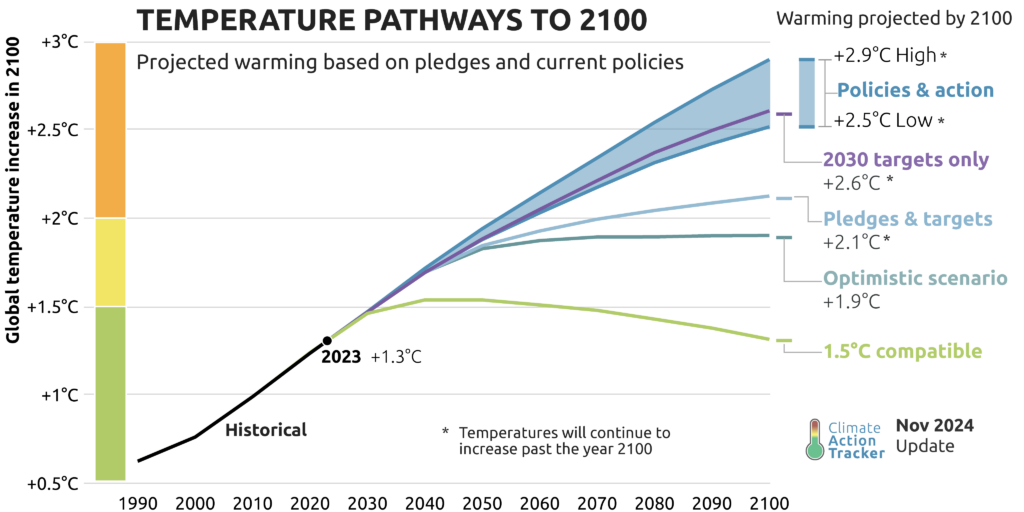
Let’s get the most obvious and arguably most depressing of these data trends out of the way first. Under the 2015 Paris Agreement, we were told that total global warming should be held below 1.5 degrees Celsius to avoid worsening climate catastrophes. Welp, we just passed that in 2024, and the projections ahead aren’t looking great. As noted by Glen Peters, a senior researcher at the CICERO (Center for International Climate Research in Oslo), in a recent paper, “It is time to admit that the world will cross 1.5°C and the likelihood of returning below 1.5°C via overshoot is slim. But, failing on 1.5°C does not mean the world has failed.”
While I’ve never personally put too much weight into the whole 1.5 degree number, the broader takeaway is clear: we’ve reached a point where the focus must shift from just ‘how can we avoid further climate damage?’ to also asking, ‘how will we adapt to the climate catastrophes that are now unavoidable?’
GWP Improvements in Materials
On a more positive note I thought I’d revisit a post of mine from a little over a year ago where I had analyzed some of the Environmental Product Declaration (EPD) data for concrete in the EC3 database. One of the takeaways of that post was that we were seeing some early evidence of decreasing Global Warming Potential (GWP) values for concrete mixes over time. I wanted to revisit this to see if the trend was continuing over the last year.
While I was unable to extend the exact dataset that was used for that exercise (I suspect EC3 may have removed some older EPDs from the database or something), I was able to sample data from over 26,000 concrete EPDs, which continued to show the trend that I had seen previously. While we can only speculate about the exact causes of the GWP reductions, I think it’s probably fair to say that broader general awareness of carbon emissions in the production of concrete is having a positive impact on the materials being produced. We’re seeing a fairly steady decline in GWP values year over year based on the data shown in the charts below.
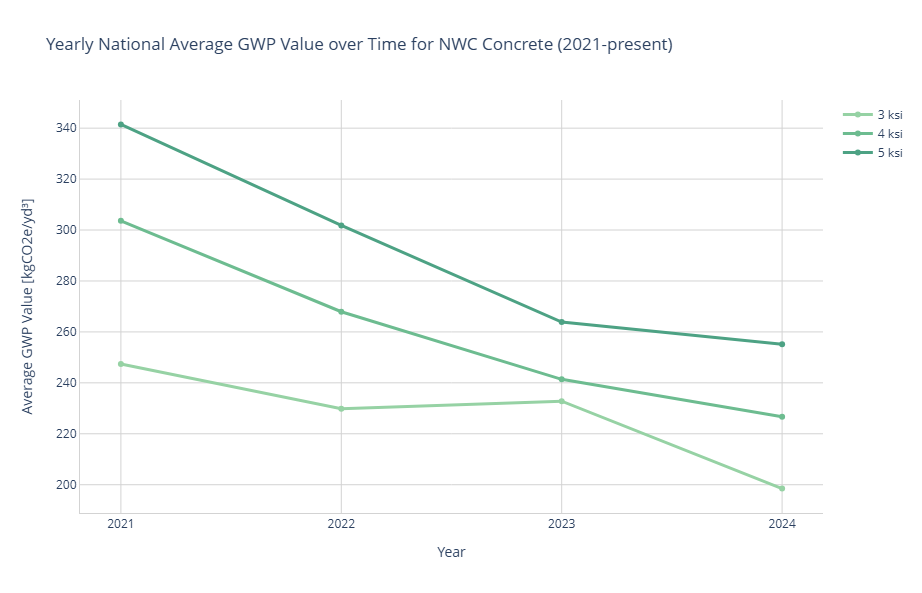
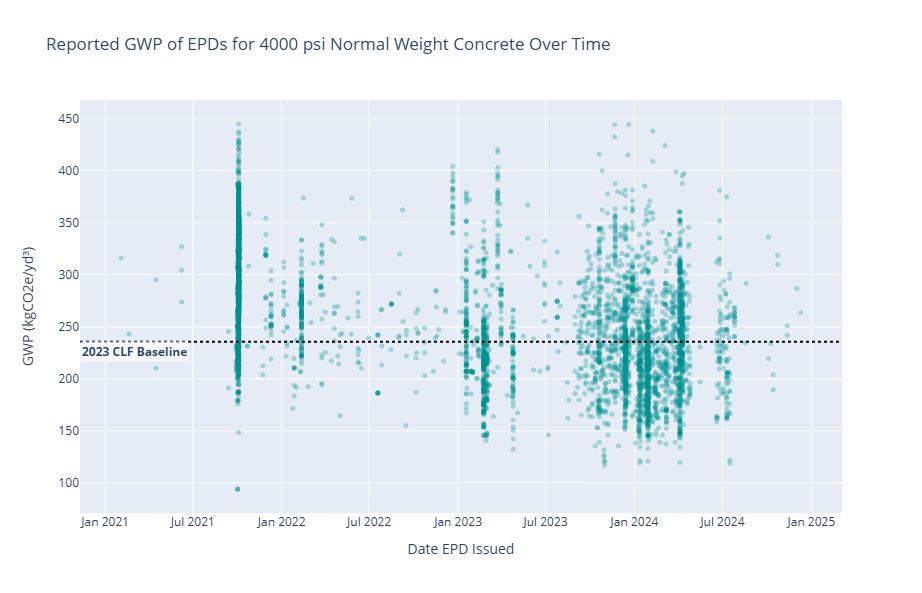
I suspect that as embodied carbon continues to make its way onto the radar for a growing number of AEC professionals, that we’ll continue to see material innovations and a growing market for low carbon options. The greening of the electrical grid over time will likely also account for a large portion of the reductions. This is an opportunity that can snowball since manufacturers may seek out regions on cleaner energy grids in order to reduce the GWP of their products, which in turn creates incentives for regions to attract businesses by more rapidly switching over to renewables.
Tangible Policies Are More Often Developed and Deployed Locally
It’s no secret that the incoming Trump administration plans to roll back many of the environmental policies implemented over the past few years. While this could certainly have damaging effects, the reality is that many policies, especially those related to energy, are developed and enacted locally rather than at the national or global level. This is particularly true for policies addressing embodied carbon.
The below map shows just what’s on the Carbon Leadership Forum’s ‘Policy Tracking Map’, for locations with specific policies related to embodied carbon. And in reality this map is really just a small sampling of the ones that have been noted in the past. A comprehensive map would contain many more points, though accurately capturing every policy would be nearly impossible as these are evolving on a daily basis.

I suppose this point is the closest I’ll get to a “silver-lining” of sorts among the trends discussed. The reality is that many of the wheels are already in motion at local levels for policies to be put into play. And while climate may not be the most important topic for many Americans, a study by the Pew Research Center done in 2022 showed that nearly 69% of Americans favored the U.S. taking steps to become carbon neutral by 2050. It’s hard to believe that over two-thirds of Americans can agree on anything these days, but here we are! And so while the incoming administration can do their best to slow down the fight against climate change, the reality is that momentum at the state and local levels is already moving towards decarbonizing. Evidence of this was seen during the recent election where many of the climate initiatives that appeared on state ballots gained voters’ approval.
Meeting Building Demand: Efficiency vs. Expansion
When attending sustainability-focused seminars or discussions, I often hear presentations that start with eye-catching statistics about the scale of construction needed to meet demand. Common examples include, “we’re building the equivalent of one New York City every 30 days” or “we need to build 13,000 buildings every day through 2050.” These figures are helpful for providing an easily-digestible tidbit for somebody to get a sense of the scale at which we’re building, but they leave out an important part of the equation. We should also be paying attention to area per occupant and what we can do to design more efficiently at both the building level and also the urban planning level. We don’t need to be building that much if we’re smarter about using what we currently have.
Metrics for both commercial and residential buildings have begun to shift in recent years. The area per employee number in commercial real estate had been declining up until the pandemic. The shift towards more remote and hybrid work make the former metrics a bit outdated, so I won’t delve too deep into what muddy data does exist. Suffice to say, there’s a lot of commercial office space currently sitting vacant, and there’s little good reason to be building more of it in cities like New York.
Housing data in the U.S., on the other hand, is a bit clearer. When we look at single-family detached homes – which make up about two thirds of the housing units in the US – we see a trend toward downsizing. U.S. Census Bureau data shows that the size of new single-family homes has been shrinking for nearly a decade. Since 2015, the only year that saw an increase in home sizes was 2021, due to the pandemic-induced desire for extra space and low interest-rates. The decline has resumed since 2022, and I suspect will continue to decline given the market conditions. Another cause of the recent declines is likely due to a reduction in the average household size for Americans. We’ve seen a steady decline from an average household size in 1973 of 3.01 to 2.51 in 2023. When we factor this in, and take a square foot per-inhabitant look at the data, we see more of a leveling off over the last decade rather than a reduction.
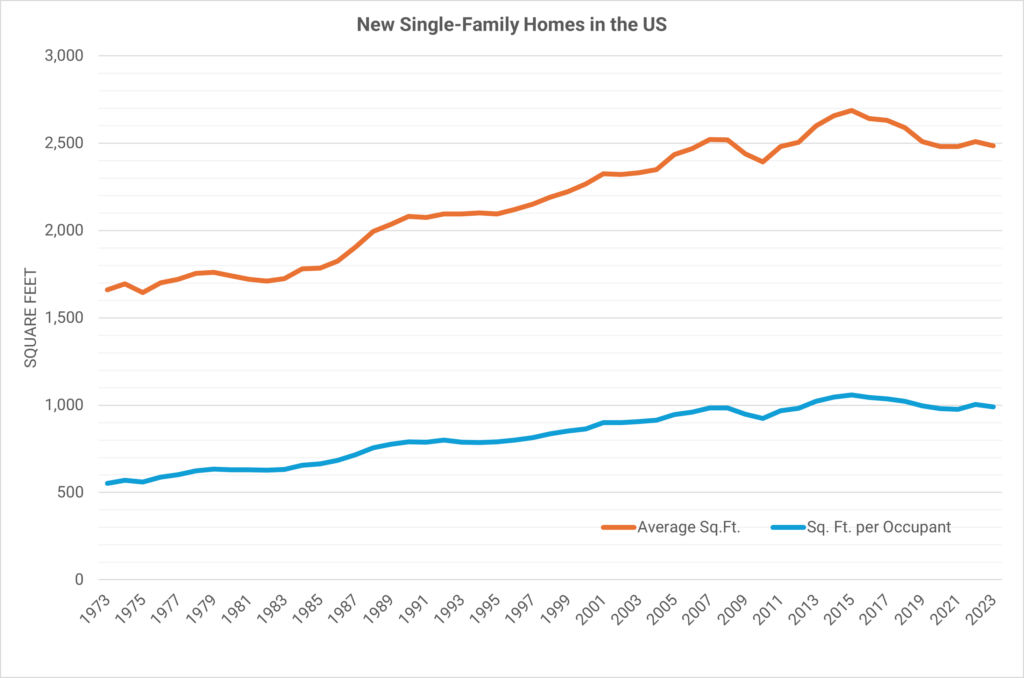
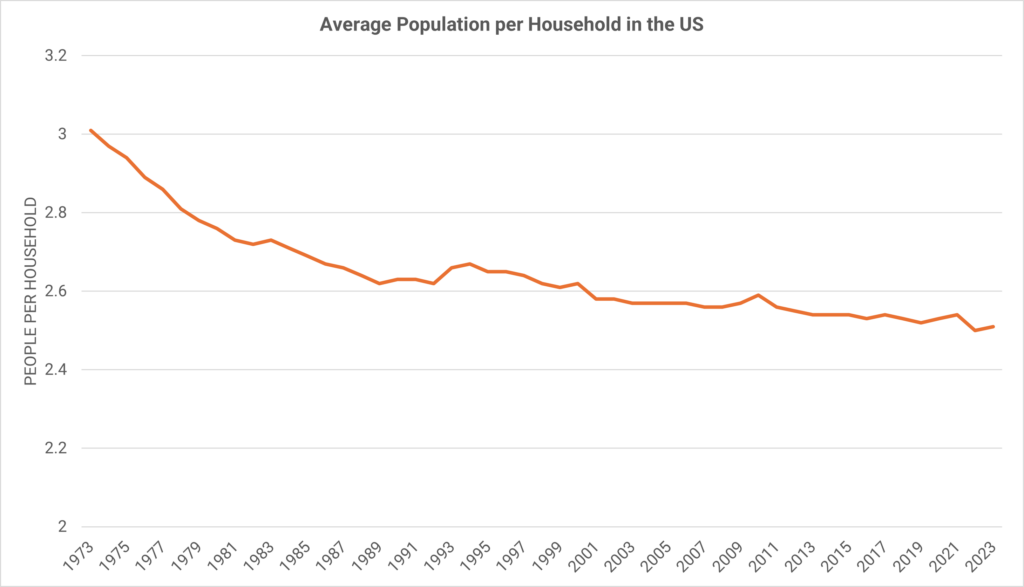
While there’s bound to be variation from region to region, broader forces such as increased remote work, rising interest rates, and declining family size (at least within the US) appear to be resulting in the downsizing of buildings. This is generally a good thing from an environmental perspective, but the improvements in terms of building area per person are harder to find.
Further improvements will remain limited if we don’t spend more time asking how we can make better use of spaces rather than just how we can build more. And since the fees of AEC professionals are often tied directly to building more stuff, the pressure for more efficient use of space and existing building stock may need to come from elsewhere.
Conclusion
So, here we are in 2025, a year that feels to me less like a fresh start and more like a sequel to a movie that didn’t need one. Global warming goals? Out of reach. McMansions? Slightly smaller, but just as awful. What about recycling? Well, there’s a good chance we’re still sorting it incorrectly, but at least we’re trying!
While the world might not be solving climate change with a magic wand, there’s still some signs in the data of things trending in the right direction – from lower carbon emitting materials to growing momentum behind policies at the local level. Of course, this data is just a small slice of the broader climate and energy landscape, but it captures a larger picture: one in which we must acknowledge our failures while stubbornly holding on to glimmers of progress.
